Measuring Brittleness in GUI Grounding Models using GUI-Perturbed
Yangyue Wang1, 2, Yash Mathur*2, Tony Zhou*2, Jinu Nyachhyon*2, Pranav Guruprasad1, 2, Harsh Sikka*1, 2
* Equal contributions. 1Fig; 2Manifold Research Group.
TL;DR
- We release a baseline study of 7B GUI models using GUI-Perturbed to stress test CUA models GUI and understand what agents fail at and why.
- We include a detailed failure mode analysis showcasing common GUI failure modes from spatial reasoning, false visual heuristics to CoT reasoning's effect
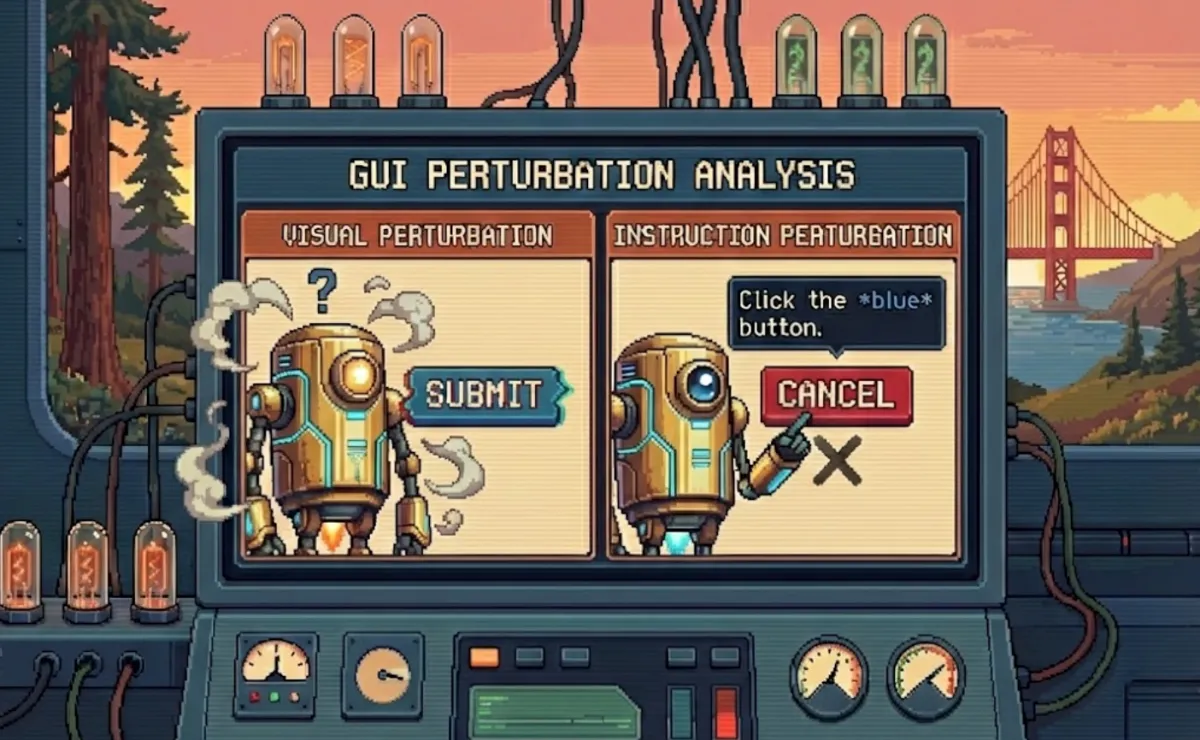
GUI Perturbation — Research Series
GUI models scoring above 90% on ScreenSpot-v2 fail to find the target element when you set web page zoom to 70% [1]. Same website, same layout, same UI elements. Just smaller.
These models were trained on hundreds of thousands to millions of GUI screenshots through supervised fine-tuning and reinforcement learning stages. They still cannot adapt to a zoom change.


figure 1: Sample: 21 of 390: "Click on 'View Deal' button for flight '#2125, #2126'", Direct Instruction, No Reasoning. Result: UI-TARS1.5-7B clicked on the fake 'view deal' button in the ads after the 70% zoom.
In Part 1, we introduced GUI-Perturbed, a dataset that varies visual scenes and instructions along controlled axes to stress test CUA model's GUI grounding capability. In this post, we use it as a benchmark to evaluate three state-of-the-art models that share the same base checkpoint but differ in their post-training recipes, and we report where they break.
The failures are not random. They cluster around two specific weaknesses: spatial reasoning and visual robustness. Models that benchmarks call production-ready fall apart under perturbations that any real user might encounter.
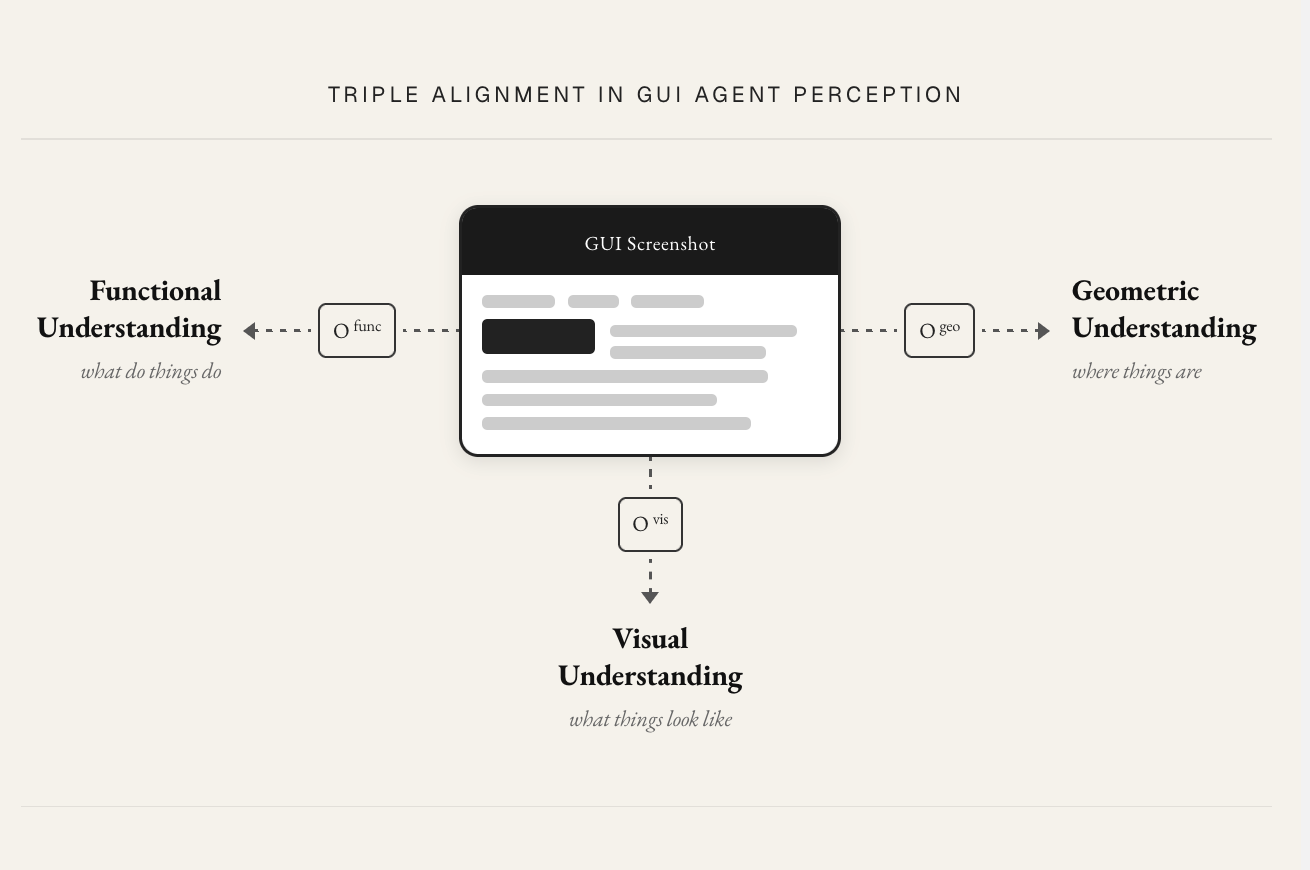
The triple alignment problem
GUI grounding is harder than standard VQA or language tasks because the model must align three things simultaneously.
Visual alignment requires identifying the element’s appearance in pixel space: its shape, color, size, and boundaries. Functional alignment requires understanding what the element does, distinguishing an input field from a display label, or a clickable button from a static icon. Geometric alignment requires resolving spatial relationships between elements: “above,” “next to,” “the one between X and Y.
Most benchmarks test these three capabilities entangled together [2, 3]. A model that fails on a complex task could be failing at any of them, and the benchmark cannot tell us which. GUI-Perturbed perturbations are designed to stress visual and geometric alignment independently, so we can isolate which one breaks. (Our current perturbation set does not include instructions that test functional alignment in isolation, such as those in AutoGUI’s dataset [4]. This is a direction for future work.)
This framing will carry through the rest of the post. When we present results, we will map each finding back to which alignment axis it reveals a weakness in.
Problem Formulation
The Computer use agent (CUA) problem can be formalized within the partially observable Markov decision process (POMDP) framework commonly used for sequential decision-making agents [9-11], as demonstrated by recent agentic model like Kimi K2.5 [12]
The POMDP tuple defines the CUA problem structure: hidden app states, observations (screenshots + goal), actions, transition dynamics, and reward [12].
\[ \mathcal{M} \;=\; \langle\, \mathcal{S},\; \mathcal{A},\; \mathcal{O},\; \underbrace{\mathcal{T}(s_{t+1}\mid s_t, a_t)}_{\text{transition}},\; \mathcal{R} \,\rangle \]At each step, a CUA model receives an instruction $I$ and an observation $O$ (the screenshot), optionally produces a chain of thought $T$, and outputs an action $A$. The full step can be written as:
\[ O_t \;\sim\; \mathcal{Z}(O_t \mid s_t), \qquad (t_t,\, a_t) \;=\; \mathrm{VLM}_\theta\!\left( I,\; O_{1:t},\; t_{1:t-1},\; a_{1:t-1} \right), \quad I \in \mathcal{I} \]Triple alignment is the key representational challenge: to select a correct action $a_t$, the model must be able to interpret $O_t$ along three axes visual appearance, geometric relation, functional affordance of the GUI from screenshots simultaneously.
\[ a_t \;=\; \pi_\theta\!\left(I,\; O_{1:t},\; t_{1:t-1}\right), \qquad O_t \;\supseteq\; \left(\, \underbrace{O_t^{\mathrm{vis}}}_{\substack{\text{visual}\\\text{appearance}}},\; \underbrace{O_t^{\mathrm{geo}}}_{\substack{\text{geometric}\\\text{layout}}},\; \underbrace{O_t^{\mathrm{func}}}_{\substack{\text{functional}\\\text{affordance}}} \,\right) \]Our evaluation isolates the grounding step: given $(I, O)$, predict the correct element. This removes multi-step dependencies and focuses the evaluation on the single-step alignment problem described above. We do evaluate models in both reasoning and no-reasoning configurations, which introduces a planning-like component through the thought trace $T$, and we report on its effects below.
Experimental setup
Three models, one base checkpoint
We evaluate three 7B-parameter models that share the same base model (Qwen2.5VL-7B) but underwent different post-training:
Qwen2.5VL-7B is the base VLM. It has seen some GUI trajectories during its long-context pre-training stage, but has not received dedicated GUI fine-tuning [5].
UI-TARS-1.5-7B is initialized from Qwen2.5VL-7B and further trained on end-to-end GUI trajectory data [8]. The authors have not publicly confirmed the specific training methods, but based on the UI-TARS and UI-TARS2 papers, the recipe likely involves SFT and/or GRPO.
GTA1-7B is initialized from UI-TARS-1.5 and further trained on GUI data using GRPO [7] at step level.
| Qwen2.5VL-7B | UI-TARS1.5-7B | GTA1-7B | |
|---|---|---|---|
| Architecture | |||
| Base model | Qwen2.5VL-7B | Qwen2.5VL-7B | UI-TARS1.5-7B (grounding) + o3 (planner) |
| Training | |||
| Stages |
|
Based on UI-TARS recipe, UI-TARS1.5 training recipe not public [7]
|
RL Optimization:
|
| Training Data | |||
| Volume | 4.1T tokens | $\sim$50B tokens | Aria-UI collection (lightly cleaned) |
| Sources |
|
|
— |
This lineage is a deliberate choice. Same architecture, same base weights, different training recipes. Any performance difference between these three models is attributable to post-training, not architecture. This lets us ask a precise question: how does each additional stage of GUI-specialized training affect robustness under perturbation?
Stress test matrix
We evaluate three 7-B models from the same lineage on eight task variants from GUI-Perturbed, enabling comparisons along three axes visual variants, instruction types, and reasoning mode:
| Axis | Levels | Cardinality |
|---|---|---|
| Visual Perturbation | \(\{\text{Original},\ \text{Style},\ \text{Precision},\ \text{Text Shrink}\}\) | 4 |
| Instruction Type | \(\{\text{Directional},\ \text{Relational}\}\) | 2 |
| Reasoning Mode | \(\{\text{With CoT},\ \text{Without CoT}\}\) | 2 |
| Total Configurations per Model | $4 \times 2 \times 2 = 16$ | |
Evaluation metrics
Given a predicted point and ground truth bounding box center, and ground-truth box
$$ \begin{aligned} \hat{p}_i &= (\hat{x}_i, \hat{y}_i) \in [0,W] \times [0,H] && \text{predicted click point} \\ b_i &= (x_i, y_i, w_i, h_i) && \text{ground-truth bounding box} \\ p_i &= \left(x_i + \tfrac{w_i}{2},\; y_i + \tfrac{h_i}{2}\right) && \text{ground-truth box center} \end{aligned} $$We report three metrics that capture different aspects of grounding accuracy.
\[ \mathrm{HR} \;=\; \frac{1}{N}\sum_{i=1}^{N} \mathbf{1}\!\left[\hat{p}_i \in b_i\right] \]Hit rate measures whether the predicted coordinate falls within the bounding box of the target element. This is our primary metric: a grounding prediction either lands on the right element or it does not.
\[ \mathrm{MSE} \;=\; \frac{1}{N}\sum_{i=1}^{N} \left\|\hat{p}_i - p_i\right\|_2^2 \]Bbox Center MSE measures the squared distance between the predicted coordinate and the center of the target bounding box in pixel space. This captures how far off a prediction is when it misses.
\[ \mathrm{NMSE} \;=\; \frac{1}{N}\sum_{i=1}^{N} \frac{\left\|\hat{p}_i - p_i\right\|_2^2}{w_i \cdot h_i} \]Normalized MSE (NMSE) normalizes MSE by the element dimensions, making errors comparable across different element dimensions.
\[ D_{\mathrm{norm}} \;=\; \frac{1}{N}\sum_{i=1}^{N} \frac{\left\|\hat{p}_i - p_i\right\|_2}{\sqrt{w_i^2 + h_i^2}} \]Normalized distance (D_norm) normalizes MSE by the square root of the target element dimensions.
We focus our analysis primarily on hit rate because it most directly answers the question we care about: can the model find the right element? MSE, NMSE and D_norm provide additional signal on error magnitude but did not reveal trends beyond what hit rate already shows.
Results
Visual perturbations break models that benchmarks call robust
The headline result is that all three models degrade under visual perturbations, including perturbations as simple as changing the browser zoom level. Models scoring above 90% on fixed-scene benchmarks show significant drops on perturbed versions of the same pages.
The zoom and text-size perturbations are worth emphasizing. These are not exotic transforms. Any user adjusting their browser zoom or system font size produces exactly this kind of variation. The fact that models trained on millions of GUI screenshots cannot handle a zoom change suggests they are encoding absolute spatial positions rather than relational structure.
Spatial reasoning is the weakest link
The sharpest performance drops come from relational instruction variants. When the instruction asks the model to identify an element by its spatial relationship to a neighbor (“click the button above X”), performance falls well below what the same models achieve on direct instructions (“click the submit button”).
| Benchmark | Qwen2.5VL-7B | UI-TARS1.5-7B | GTA1-7B |
|---|---|---|---|
| ScreenSpot-v2 | 88.8 | 89.7 | 92.4 |
| ScreenSpot-Pro | 27.6 | 42.0 | 50.1 |
| OSWorld | — | $27.4 \pm 2.2\%$ | 45.2 (with o3) |
| OSWorld-G | 27.7 | 64.2 | 67.7 |
| GUI-Perturbed (Direct) | 85.4 | 89.1 | 91.5 |
| GUI-Perturbed (Relational) | 43.1 (↓\(-42.3\)) | 33.4 (↓\(-55.7\)) | 63.4 (↓\(-28.1\)) |
We also examined whether models exhibit systematic directional biases in their spatial errors. Our directional hit rate analysis shows that models perform unevenly across spatial directions, with consistently higher accuracy on instructions involving the direction “right” compared to other directions.
We note that our directional analysis relies partly on manual labeling to correct reference landmark coordinates, which limits the scale at which we can draw conclusions. The directional asymmetry we observe is suggestive of biases introduced during training or by the visual patchification process, but confirming this would require a larger controlled study.
Reasoning helps on hard tasks, hurts on easy ones
The effect of reasoning mode is not uniformly positive. Enabling reasoning (the thought trace $T$ in our formulation) produces different outcomes depending on task difficulty.
On simple direct grounding tasks, reasoning introduces unnecessary deliberation that can actively mislead the final prediction. The model “overthinks” a task that the base visual grounding would handle correctly without intermediate reasoning.
On more complex relational tasks, reasoning recovers some performance by providing useful intermediate structure: the model can reason about spatial relationships step by step rather than attempting to resolve them in a single forward pass.
GTA1 provides a particularly instructive case. It was further trained to predict coordinates directly, and it suffers degradation from reasoning on both simple and harder relational tasks. Its post-training has optimized it for direct coordinate prediction, and the reasoning trace interferes with that pipeline regardless of task complexity.
The implication is that blanket “enable reasoning” is not the right strategy. Models need exposure to diverse reasoning styles during post-training, and they need to calibrate when to reason and how much. The optimal reasoning style and length likely varies by task.
Failure mode taxonomy
We conducted a qualitative analysis of representative failures across all models and configurations. Several recurring patterns emerge.
| Failure Mode | Definition |
|---|---|
| spatialClick Region Error | The model selects the correct UI element conceptually but clicks the wrong physical area of it. |
| spatialLocation Hallucination | The model correctly identifies what to click but fabricates or misplaces its on-screen coordinates. |
| reasoningReasoning Drift | Adding explicit reasoning causes the model's grounded action prediction to deteriorate. |
| semanticGoal Hallucination | The model invents user intentions or interface functionality not specified in the instruction. |
| semanticInstruction Misinterpretation | The model misunderstands what the instruction refers to and selects a related but incorrect element. |
| visualVisual Confusion | The model relies on superficial visual cues (shape, color, position) and misidentifies the functional element. |
| spatialSpatial Reasoning Error | The model incorrectly interprets relative spatial relationships such as left, right, above, or below. |
| semanticText Matching Bias | The model interacts with visible text matching the instruction without properly grounding it to the correct UI element. |
Discussion
Models lack spatial relational understanding
The sharpest performance drops in our evaluation come from relational instructions. Models can find an element by name but cannot resolve “the field above X.” This is not a data quantity problem. These models have been trained on millions of screenshots. The issue is representational: current architectures do not build structured spatial models of GUI layouts. They encode visual features at the patch level without maintaining an explicit spatial graph of element relationships.
This maps directly to the geometric alignment axis from our framing. Visual and functional alignment may be adequate for direct grounding tasks, but geometric alignment, the ability to reason about spatial relationships between elements, is where current models fall short.
Visual heuristics are static and fragile
Models learn fixed visual associations (white rectangle at the top of the screen equals search bar) that break on any layout or style change. In the zoom perturbation results, we see models clicking on advertisement elements that happen to occupy the spatial position where the target element used to be at the original zoom level. The model has memorized a position, not learned a function.
In production, websites update their designs regularly. A model relying on static visual heuristics is one deployment away from failure. This is a visual alignment problem: the model’s visual representations are too tightly coupled to the specific pixel-level appearances in the training distribution.
Reasoning is a double-edged sword for grounding
On simple tasks, reasoning introduces unnecessary deliberation that can mislead the final prediction. On harder relational tasks, reasoning provides useful intermediate structure. The GTA1 results sharpen this point further: a model post-trained for direct coordinate prediction is actively harmed by reasoning in all conditions, because its training has optimized a pipeline that reasoning disrupts.
This suggests that post-training recipes need to consider reasoning as a learnable skill with task-dependent value, not a universal capability to be enabled or disabled. Models need exposure to varied reasoning styles and lengths during training so they can learn when deliberation helps and when it hurts.
Scope and limitations
Model coverage. We evaluate three models from one base checkpoint lineage. This design isolates the effect of post-training recipes, but it means our findings may not generalize to models with different base architectures or scales. Broader coverage is future work.
Perturbation coverage. We evaluate on eight variants from GUI-Perturbed. More perturbation types and combinations are possible, and interactions between perturbation types (for example, zoom combined with relational instructions) remain unexplored.
What’s next
This post used GUI-Perturbed as a benchmark and found systematic weaknesses in state-of-the-art GUI grounding models, particularly in spatial reasoning and visual robustness. These weaknesses persist across all three models despite increasingly specialized post-training.
The natural question is whether we can fix these weaknesses with better training data. In Part 3, we study training data’s effect on GUI grounding. We use GUI-Perturbed for data augmentation and measure whether targeted training closes the gaps we identified here. The results are instructive but counterintuitive: naive augmentation with conservative fine-tuning does not close the gap, pointing toward the need for richer post-training recipes.
At Fig, we are building systems that learn through interaction rather than observation. GUI-Perturbed exposes where current perception-based approaches fall short, and Part 3 explores what it takes to close that gap.
References
[1] K. Cheng et al., "SeeClick: Harnessing GUI Grounding for Advanced Visual GUI Agents," Feb. 23, 2024, arXiv: arXiv:2401.10935. doi: 10.48550/arXiv.2401.10935.
[2] T. Xie et al., "OSWorld: Benchmarking Multimodal Agents for Open-Ended Tasks in Real Computer Environments," May 30, 2024, arXiv: arXiv:2404.07972. doi: 10.48550/arXiv.2404.07972.
[3] K. Li et al., "ScreenSpot-Pro: GUI Grounding for Professional High-Resolution Computer Use," Apr. 04, 2025, arXiv: arXiv:2504.07981. doi: 10.48550/arXiv.2504.07981.
[4] H. Li, J. Chen, J. Su, Y. Chen, Q. Li, and Z. Zhang, "AutoGUI: Scaling GUI Grounding with Automatic Functionality Annotations from LLMs," Jun. 07, 2025, arXiv: arXiv:2502.01977. doi: 10.48550/arXiv.2502.01977.
[5] S. Bai et al., "Qwen2.5-VL Technical Report," Feb. 19, 2025, arXiv: arXiv:2502.13923. doi: 10.48550/arXiv.2502.13923.
[6] Y. Qin et al., "UI-TARS: Pioneering Automated GUI Interaction with Native Agents," Jan. 21, 2025, arXiv: arXiv:2501.12326. doi: 10.48550/arXiv.2501.12326.
[7] Y. Yang et al., "GTA1: GUI Test-time Scaling Agent," Oct. 03, 2025, arXiv: arXiv:2507.05791. doi: 10.48550/arXiv.2507.05791.
[8] U.-T. Team, "UI-TARS - Next-generation native GUI agent model," UI-TARS. Accessed: Mar. 04, 2026.
[9] M. Lu et al., "Scaling Agentic Reinforcement Learning for Tool-Integrated Reasoning in VLMs," Nov. 24, 2025, arXiv: arXiv:2511.19773. doi: 10.48550/arXiv.2511.19773.
[10] L. Zhao et al., "Seeing is Believing: Belief-Space Planning with Foundation Models as Uncertainty Estimators," Apr. 04, 2025, arXiv: arXiv:2504.03245. doi: 10.48550/arXiv.2504.03245.
[11] H. Li et al., "VLA-RFT: Vision-Language-Action Reinforcement Fine-tuning with Verified Rewards in World Simulators," Oct. 01, 2025, arXiv: arXiv:2510.00406. doi: 10.48550/arXiv.2510.00406.
[12] J. Wu et al., "OS-Marathon: Benchmarking Computer-Use Agents on Long-Horizon Repetitive Tasks," Feb. 02, 2026, arXiv: arXiv:2601.20650. doi: 10.48550/arXiv.2601.20650.
[13] K. Team et al., "Kimi K2.5: Visual Agentic Intelligence," Feb. 02, 2026, arXiv: arXiv:2602.02276. doi: 10.48550/arXiv.2602.02276.
[14] B. Oliveira and C. Teixeira Lopes, "The Evolution of Web Search User Interfaces - An Archaeological Analysis of Google Search Engine Result Pages," in Proceedings of the 2023 Conference on Human Information Interaction and Retrieval, Austin TX USA: ACM, Mar. 2023, pp. 55–68. doi: 10.1145/3576840.3578320.
Citation
@online{measuring_gui_models_robustness_technical_report_2026,
  title   = {Measuring Brittleness in GUI Grounding Models using GUI-Perturbed},
  author  = {Wang, Yangyue and Mathur, Yash, and Zhou, Tony and Nyachhyon, Jinu and Guruprasad, Pranav and Sikka, Harsh},
  year    = {2026},
  url     = {https://blog.fig.inc/measuring-brittleness-in-gui-grounding-models-using-gui-perturbed},
  note    = {Part 2: Baseline evaluation}
}